
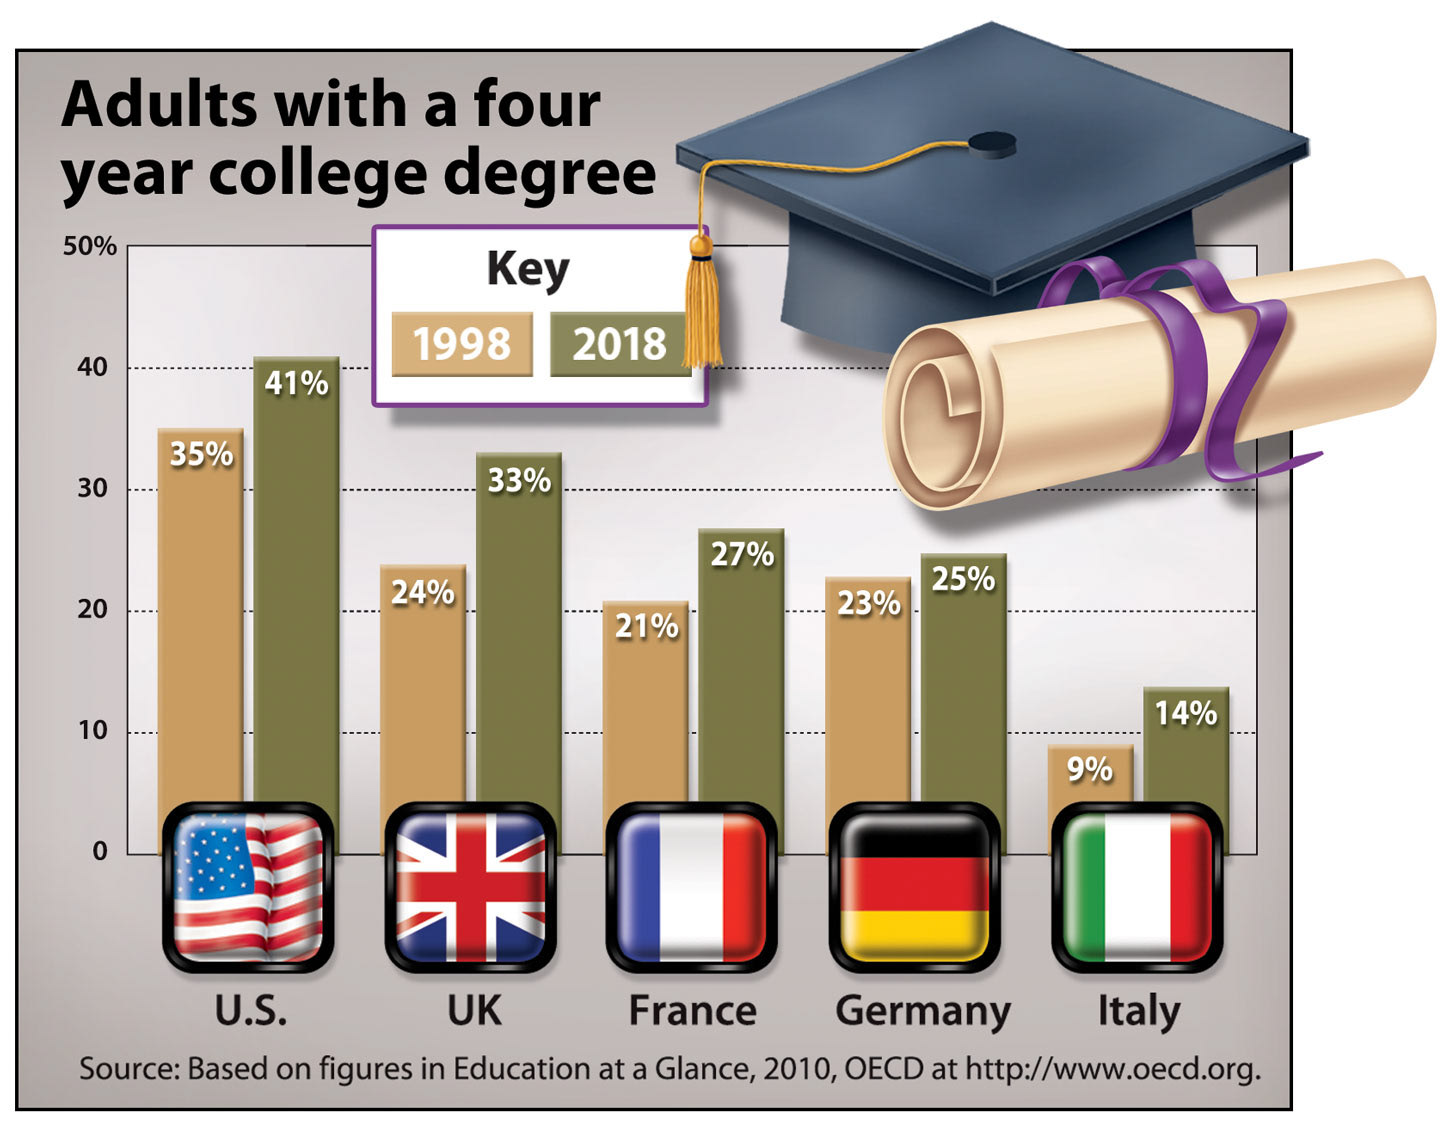
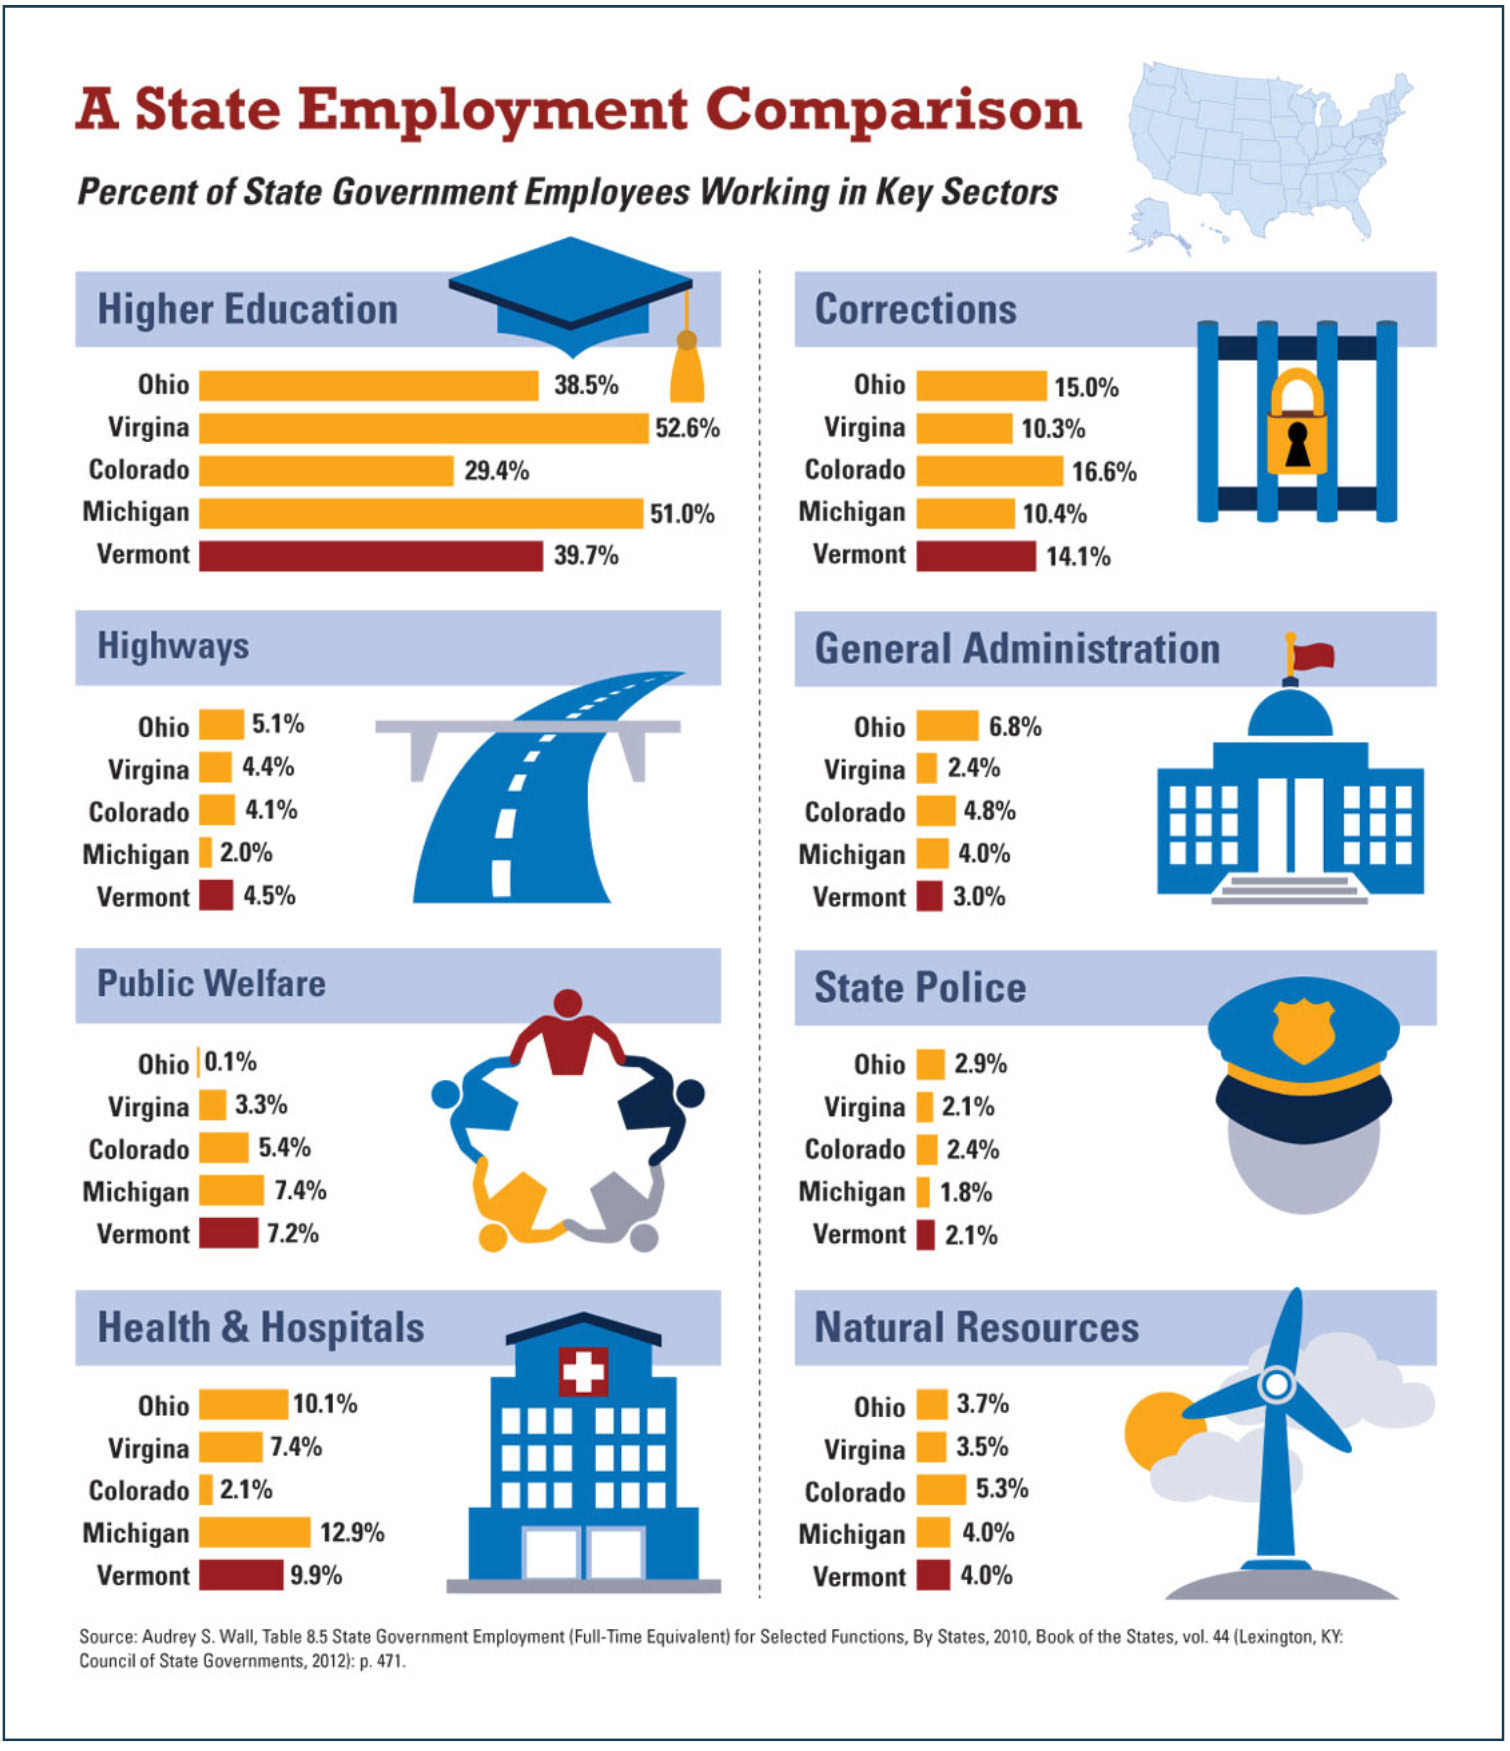
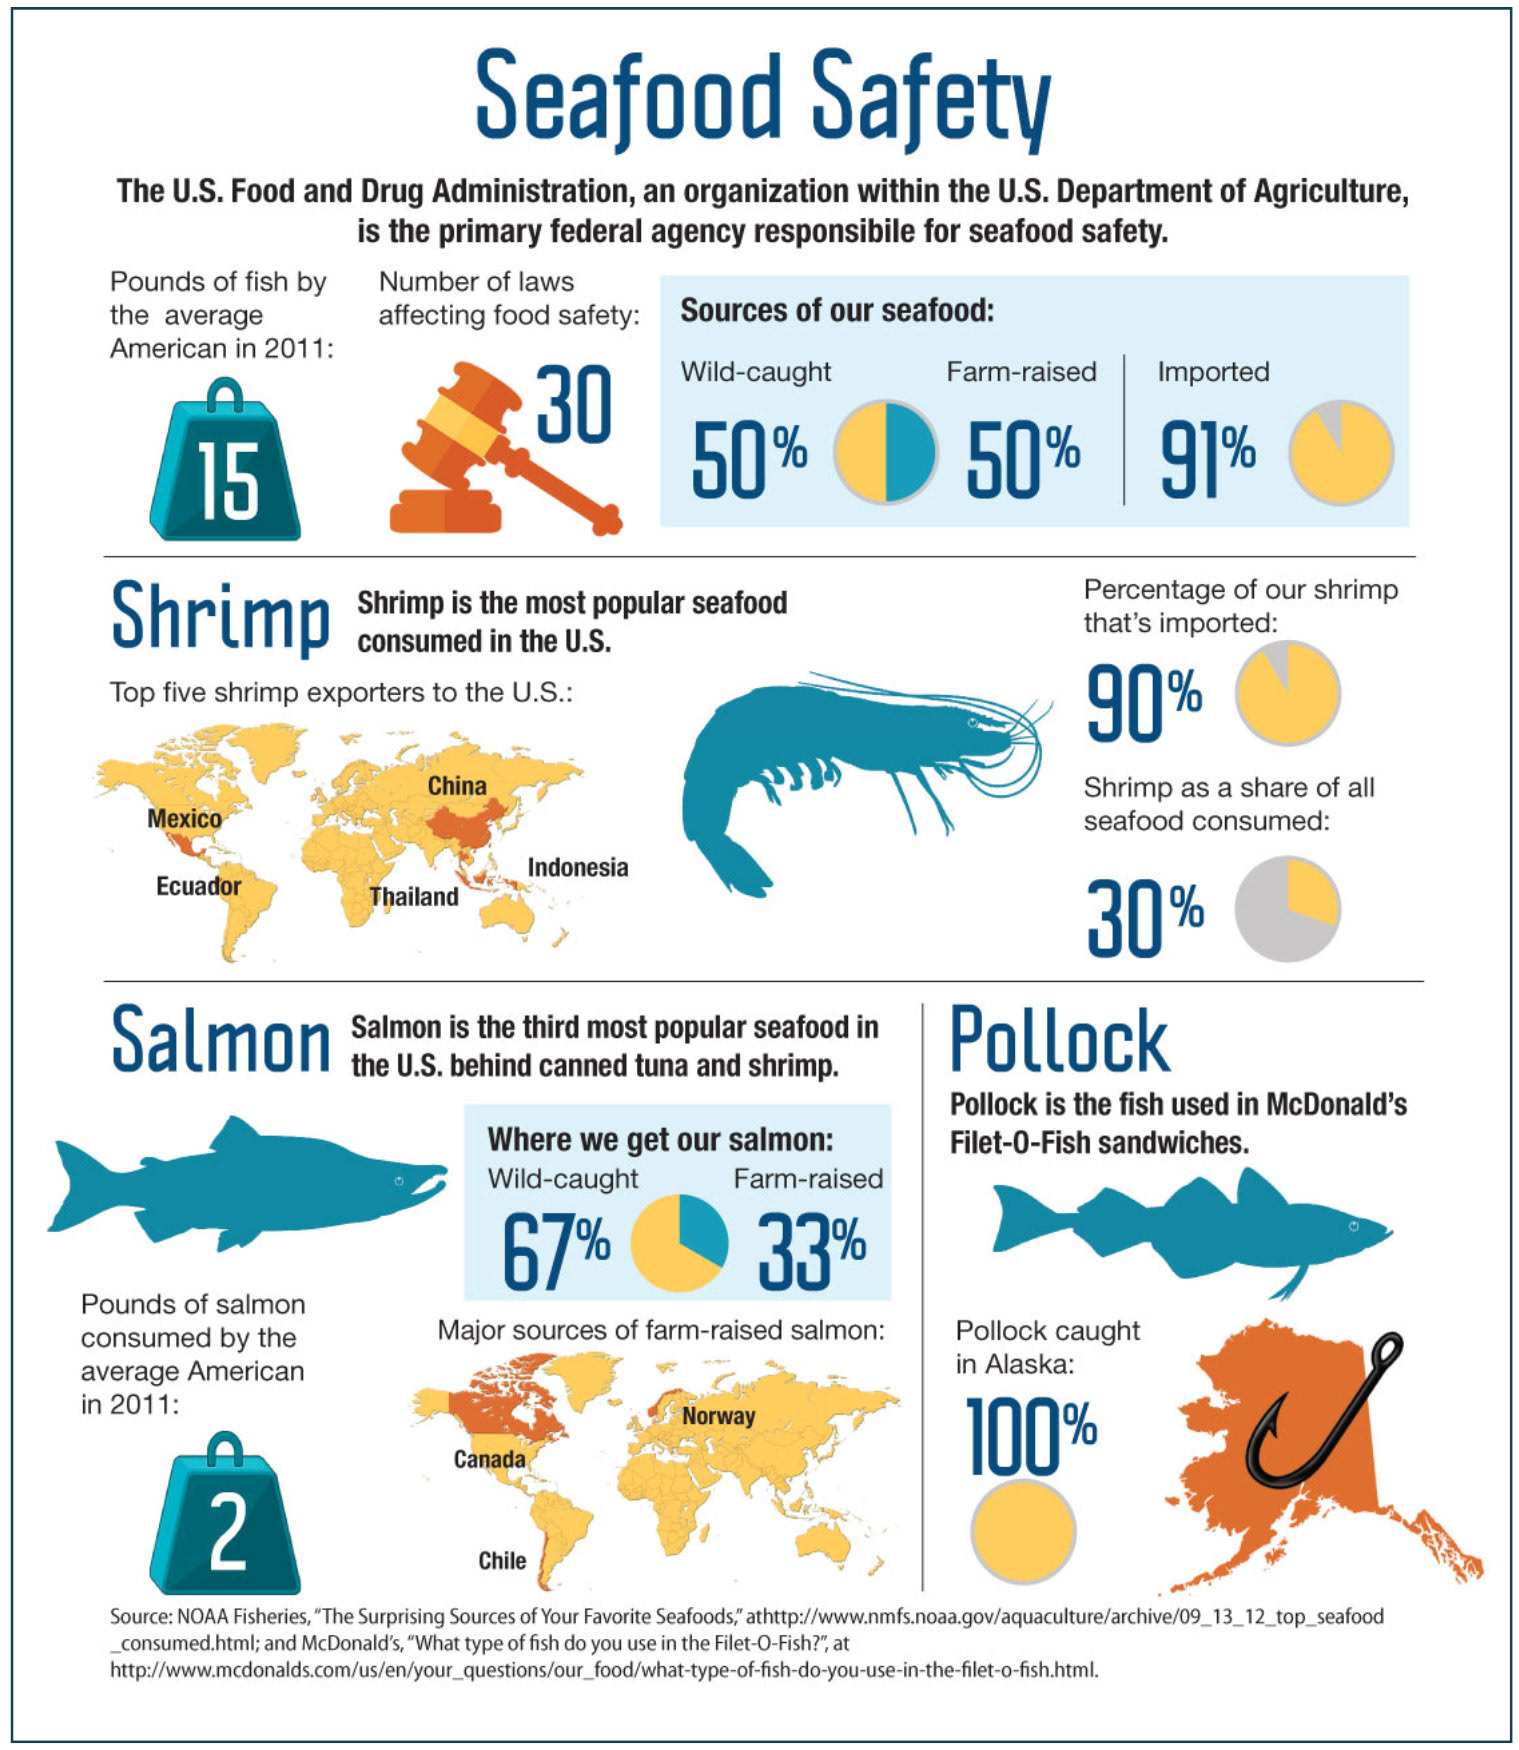
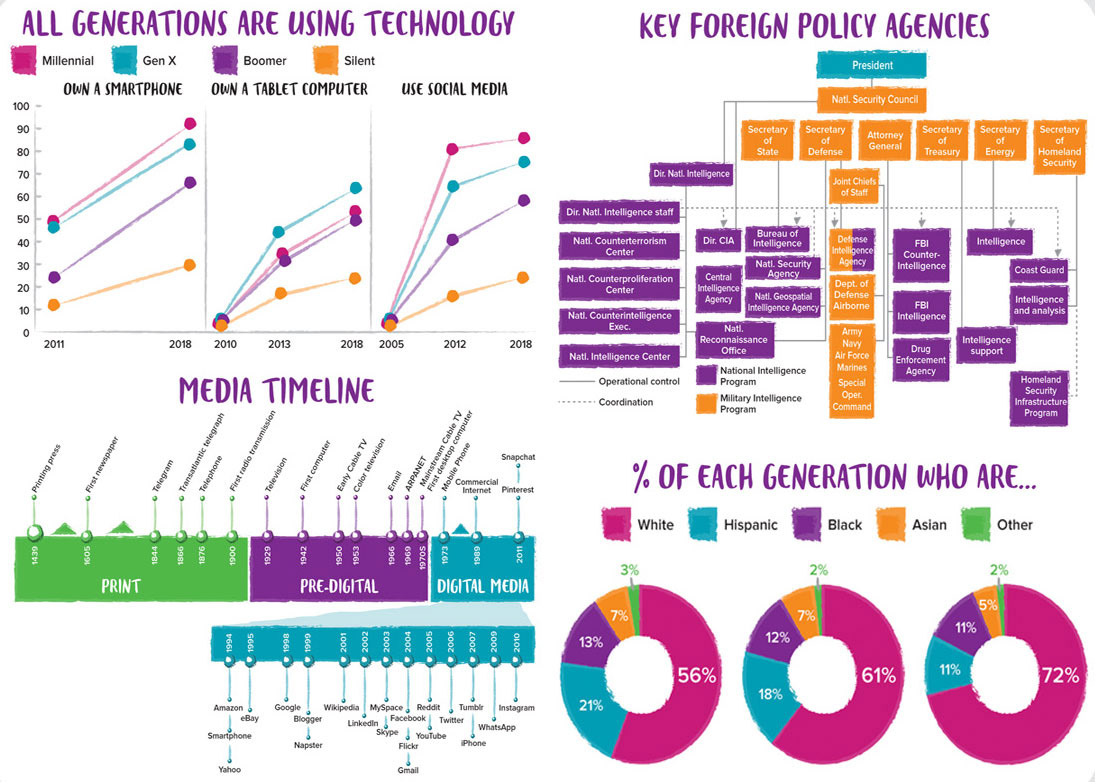

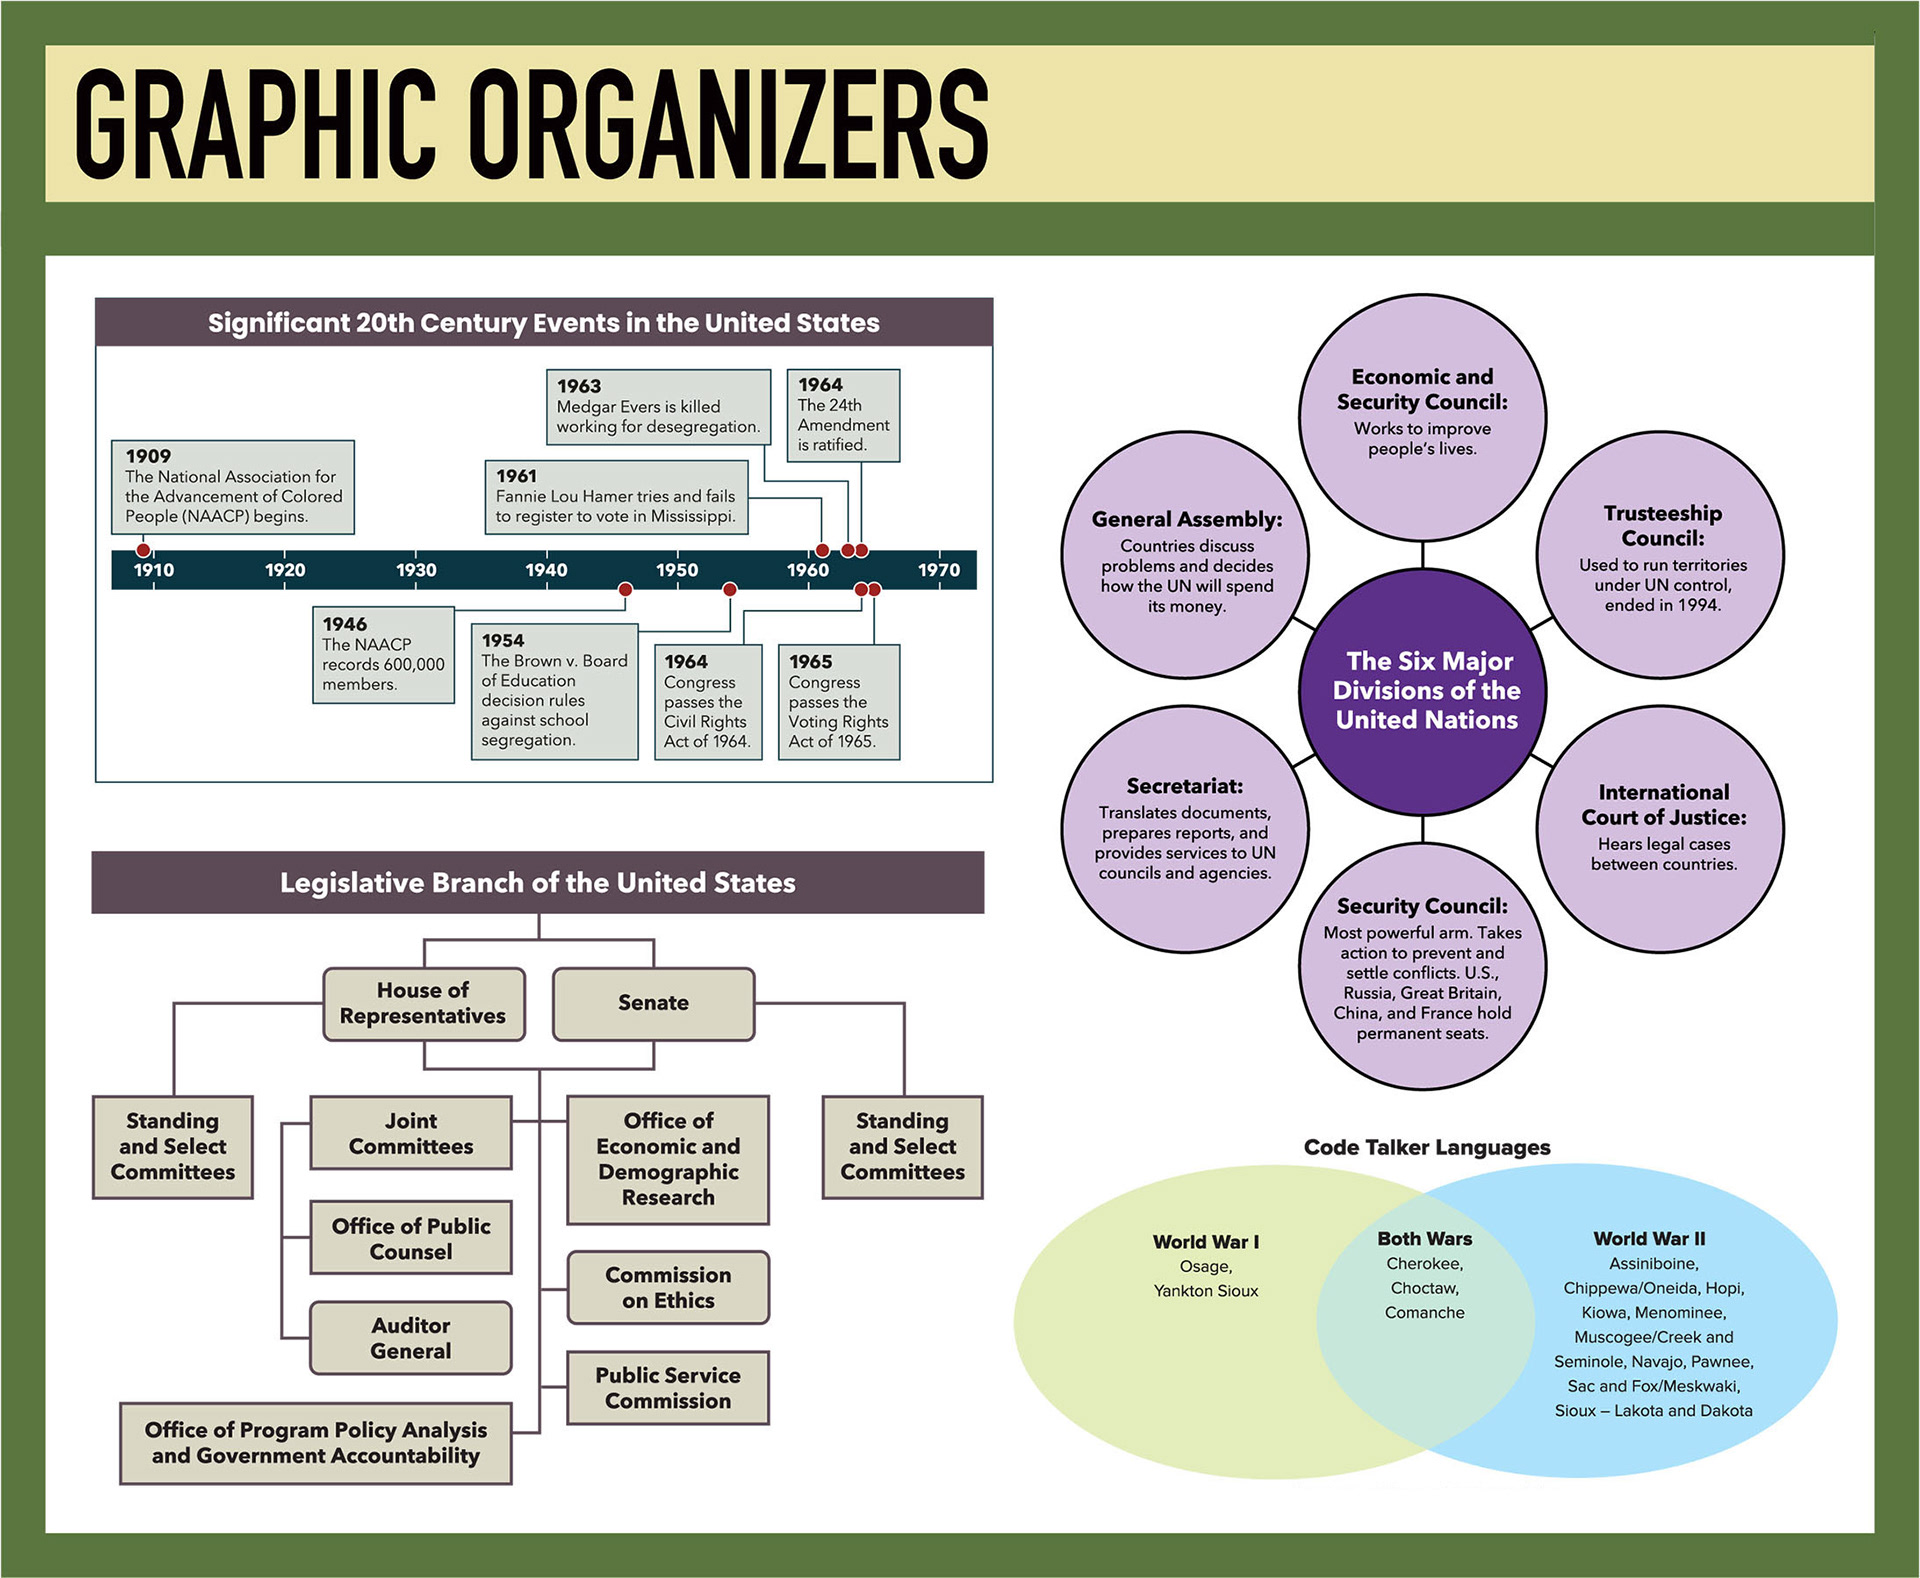
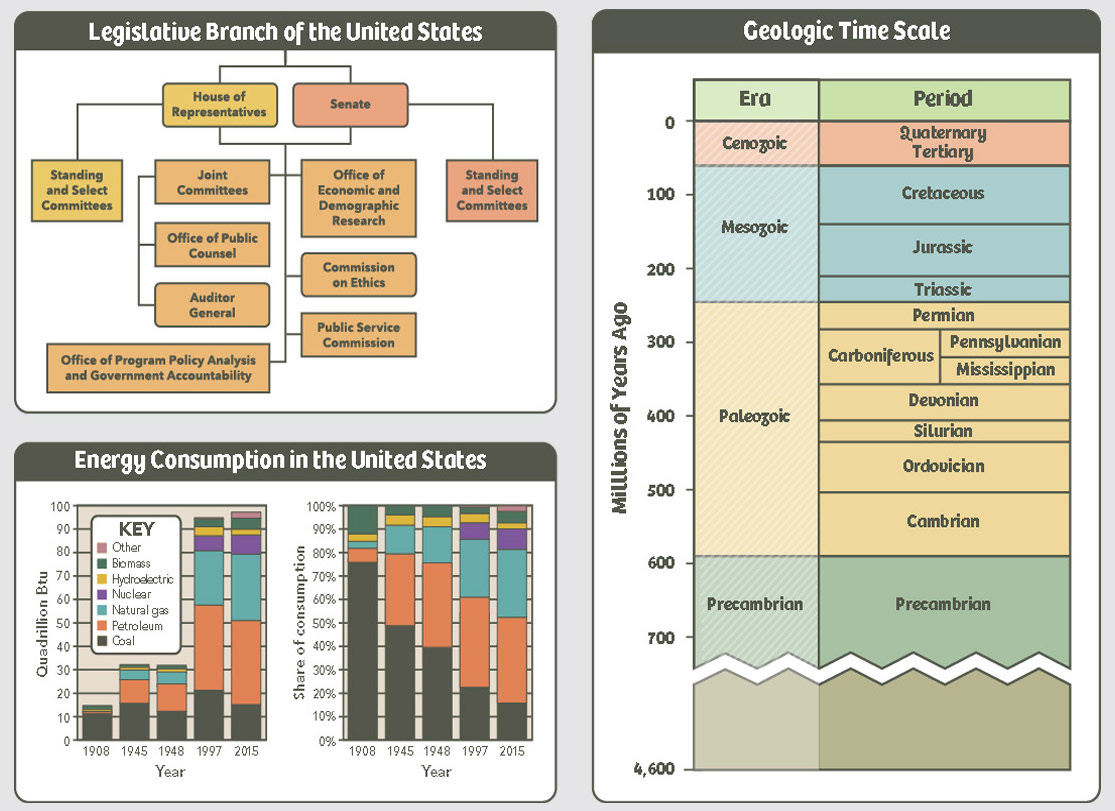
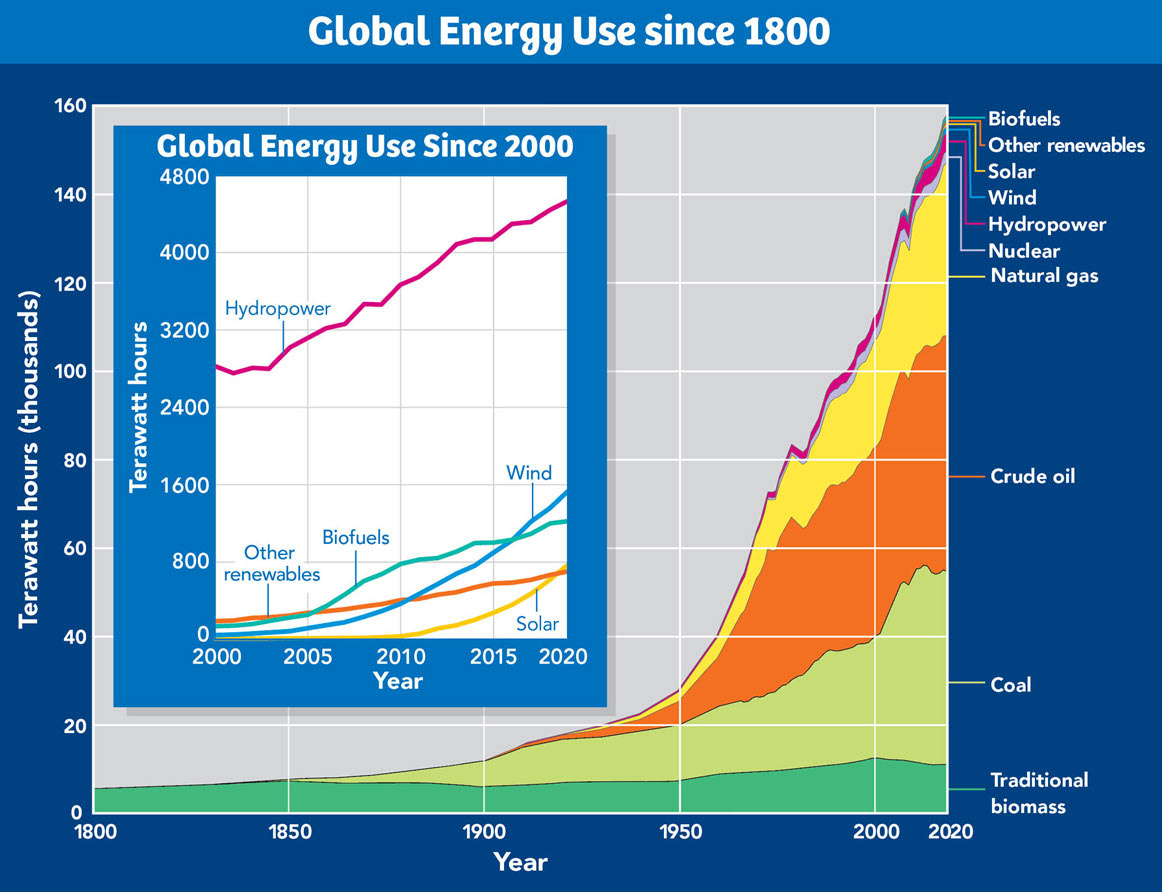
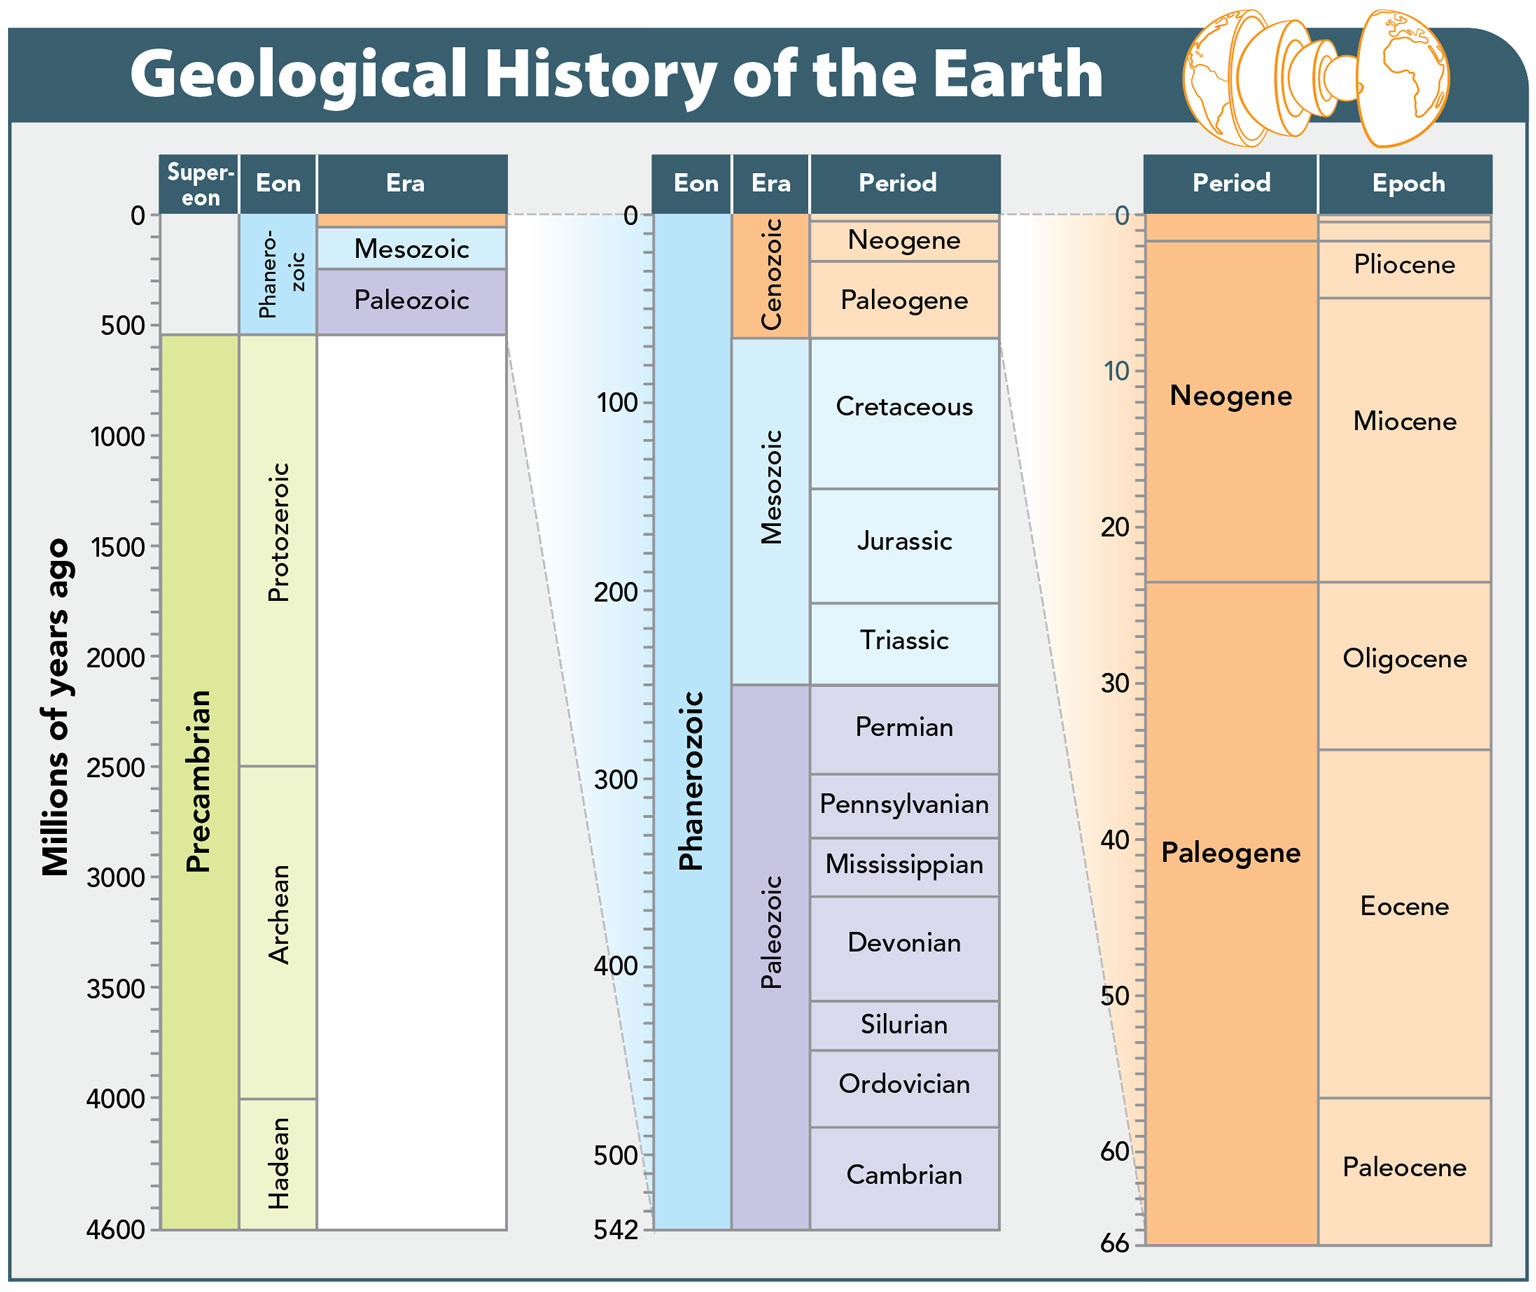
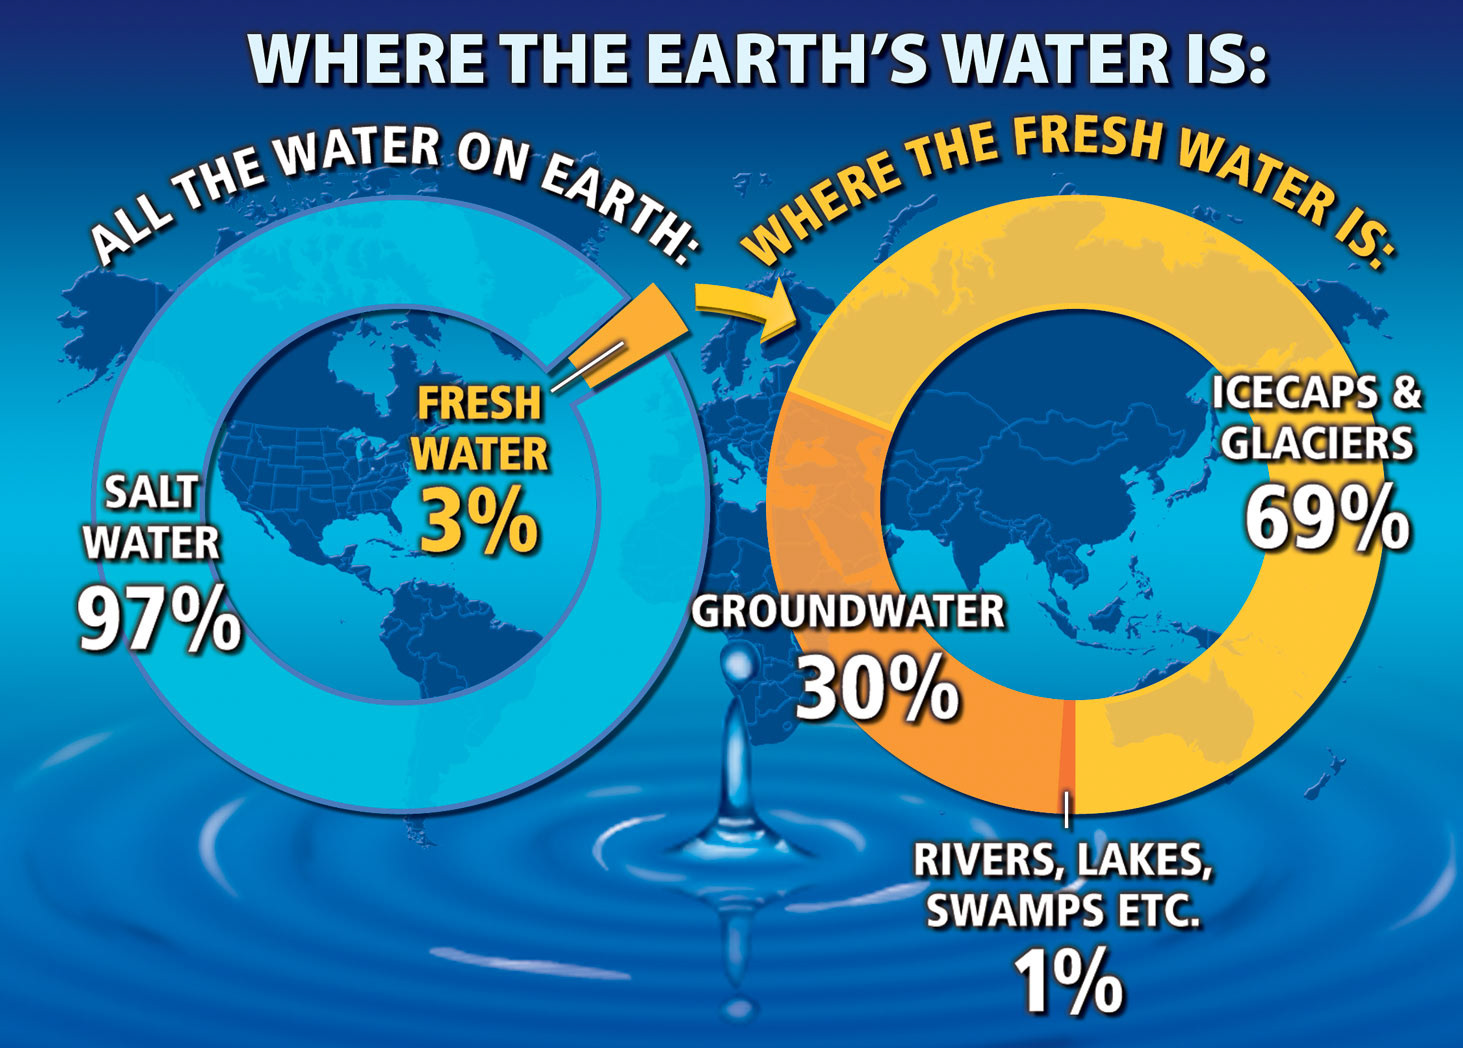
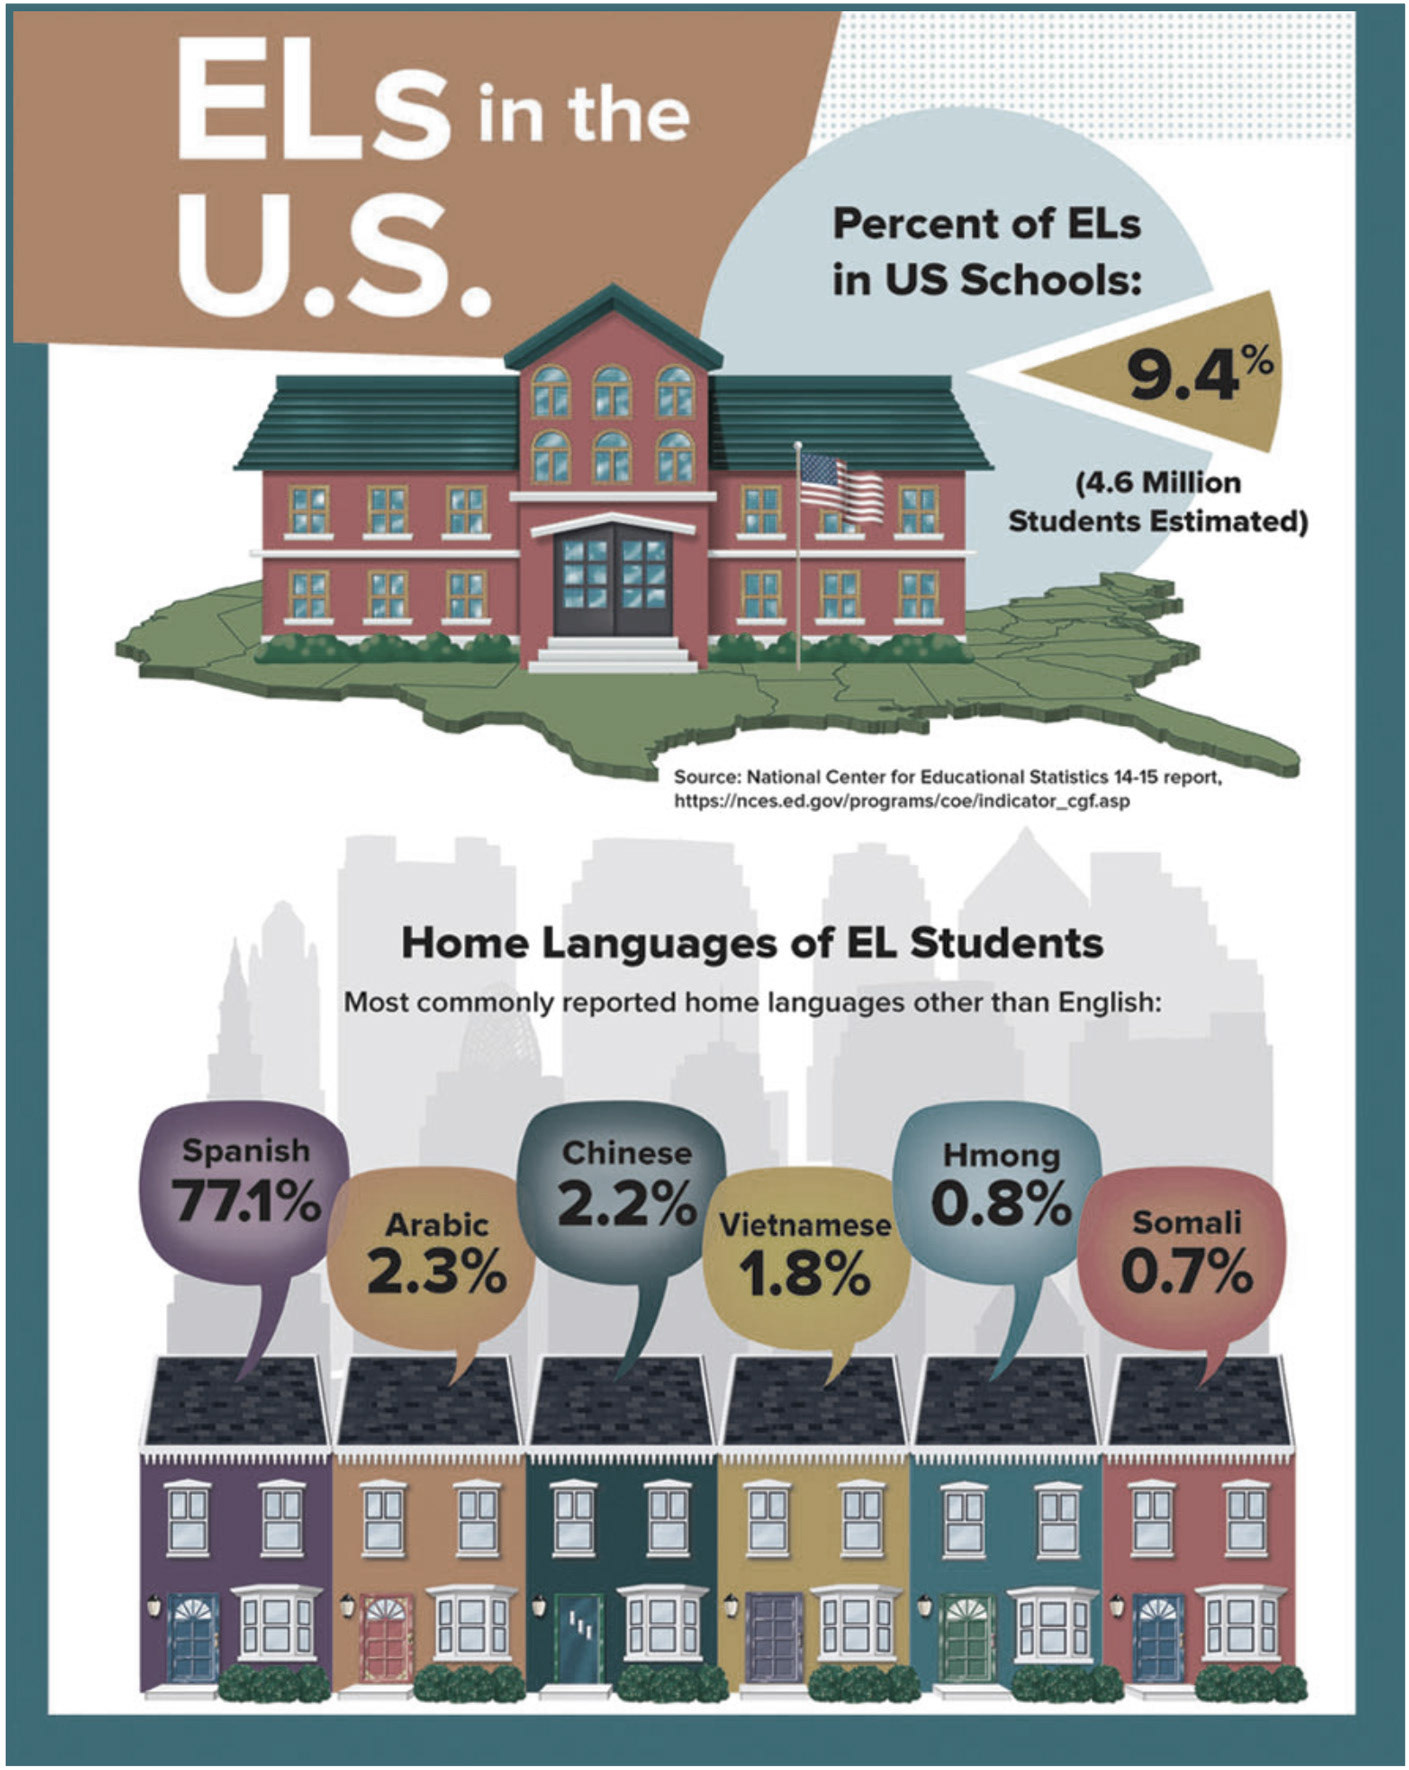
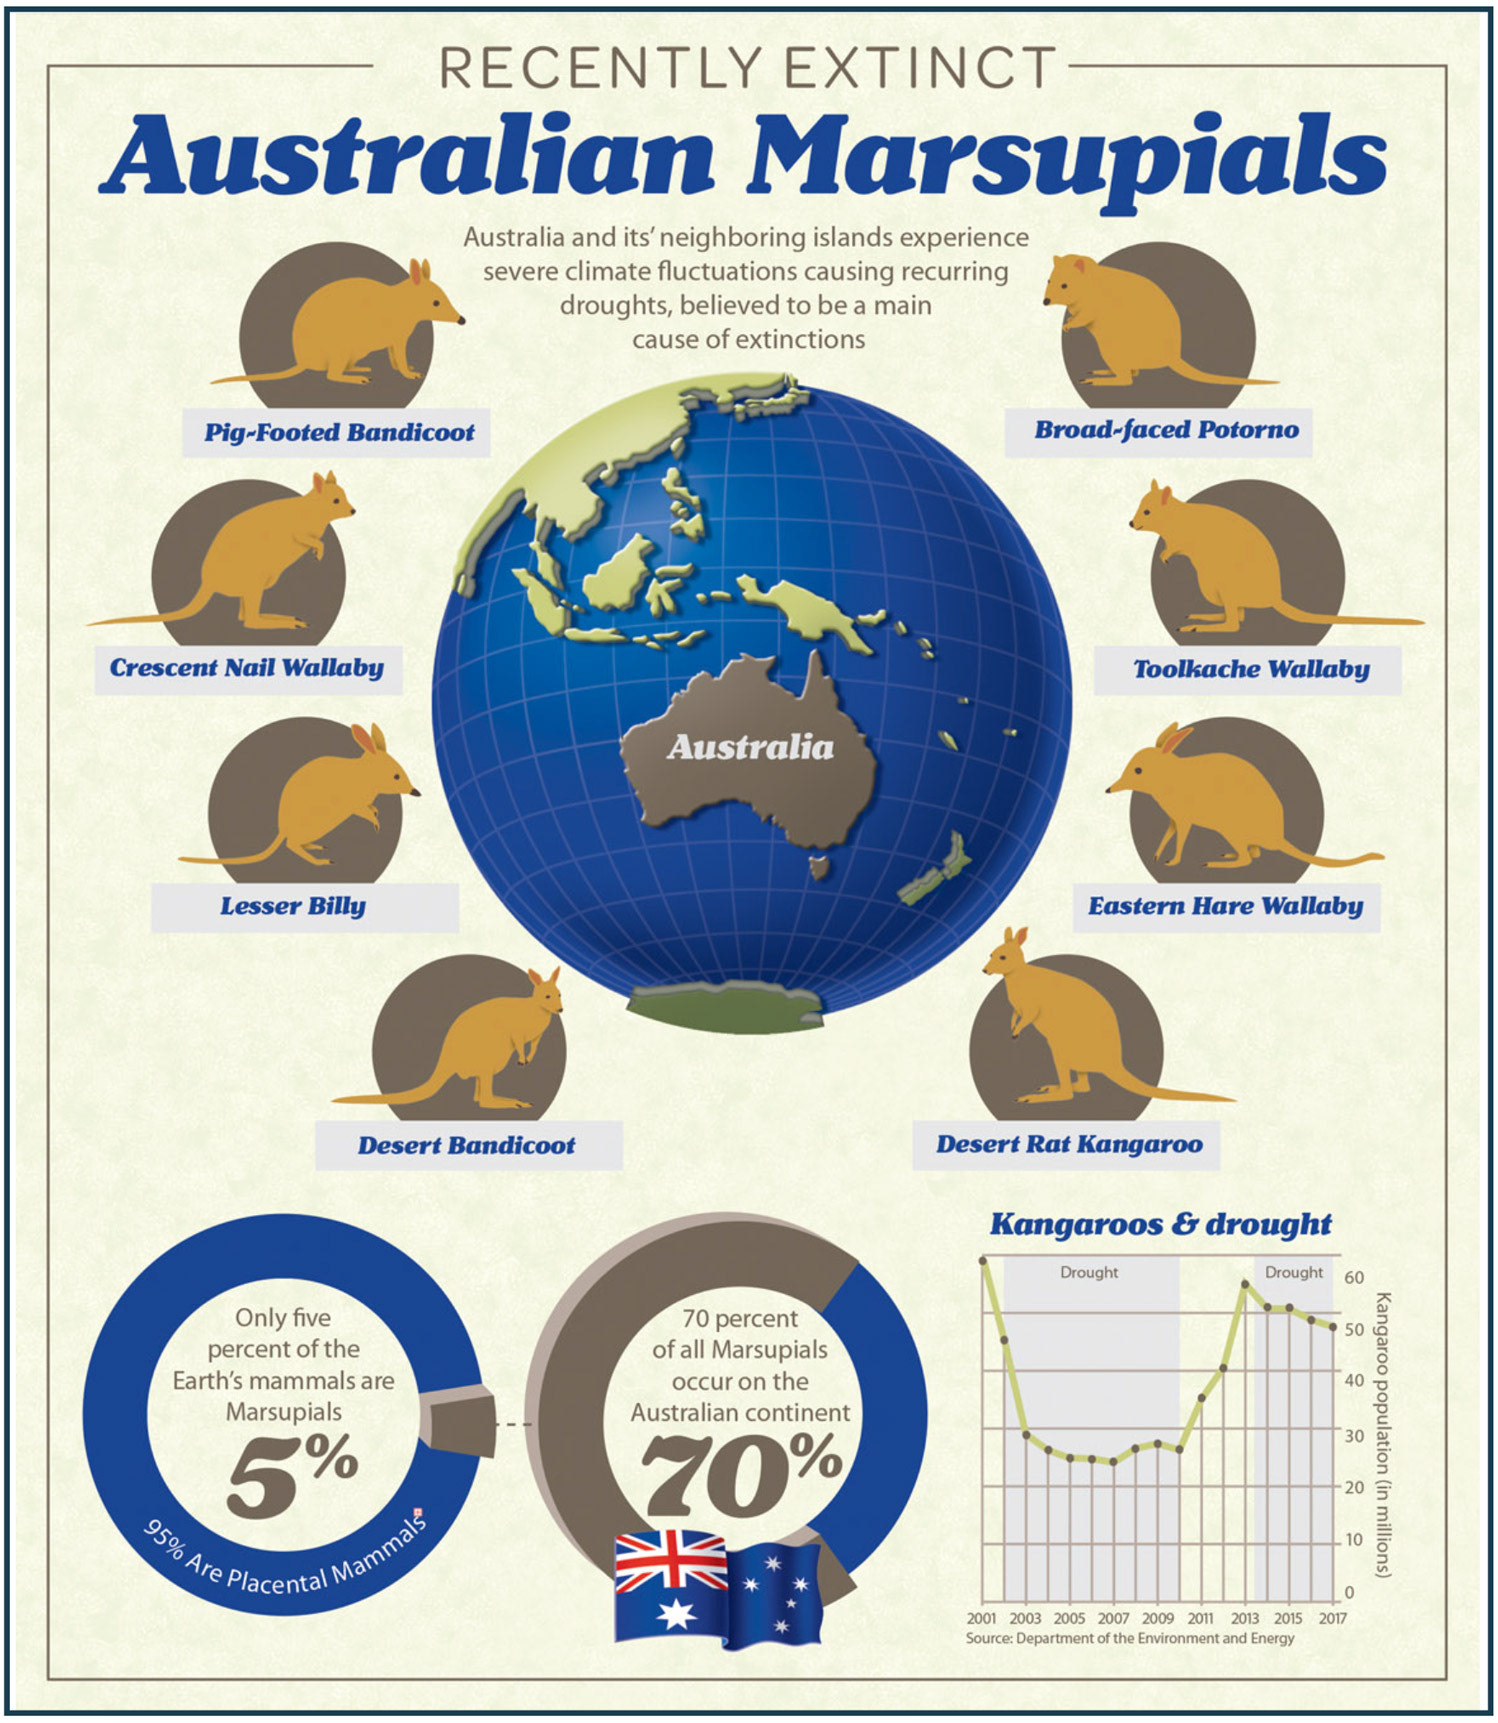
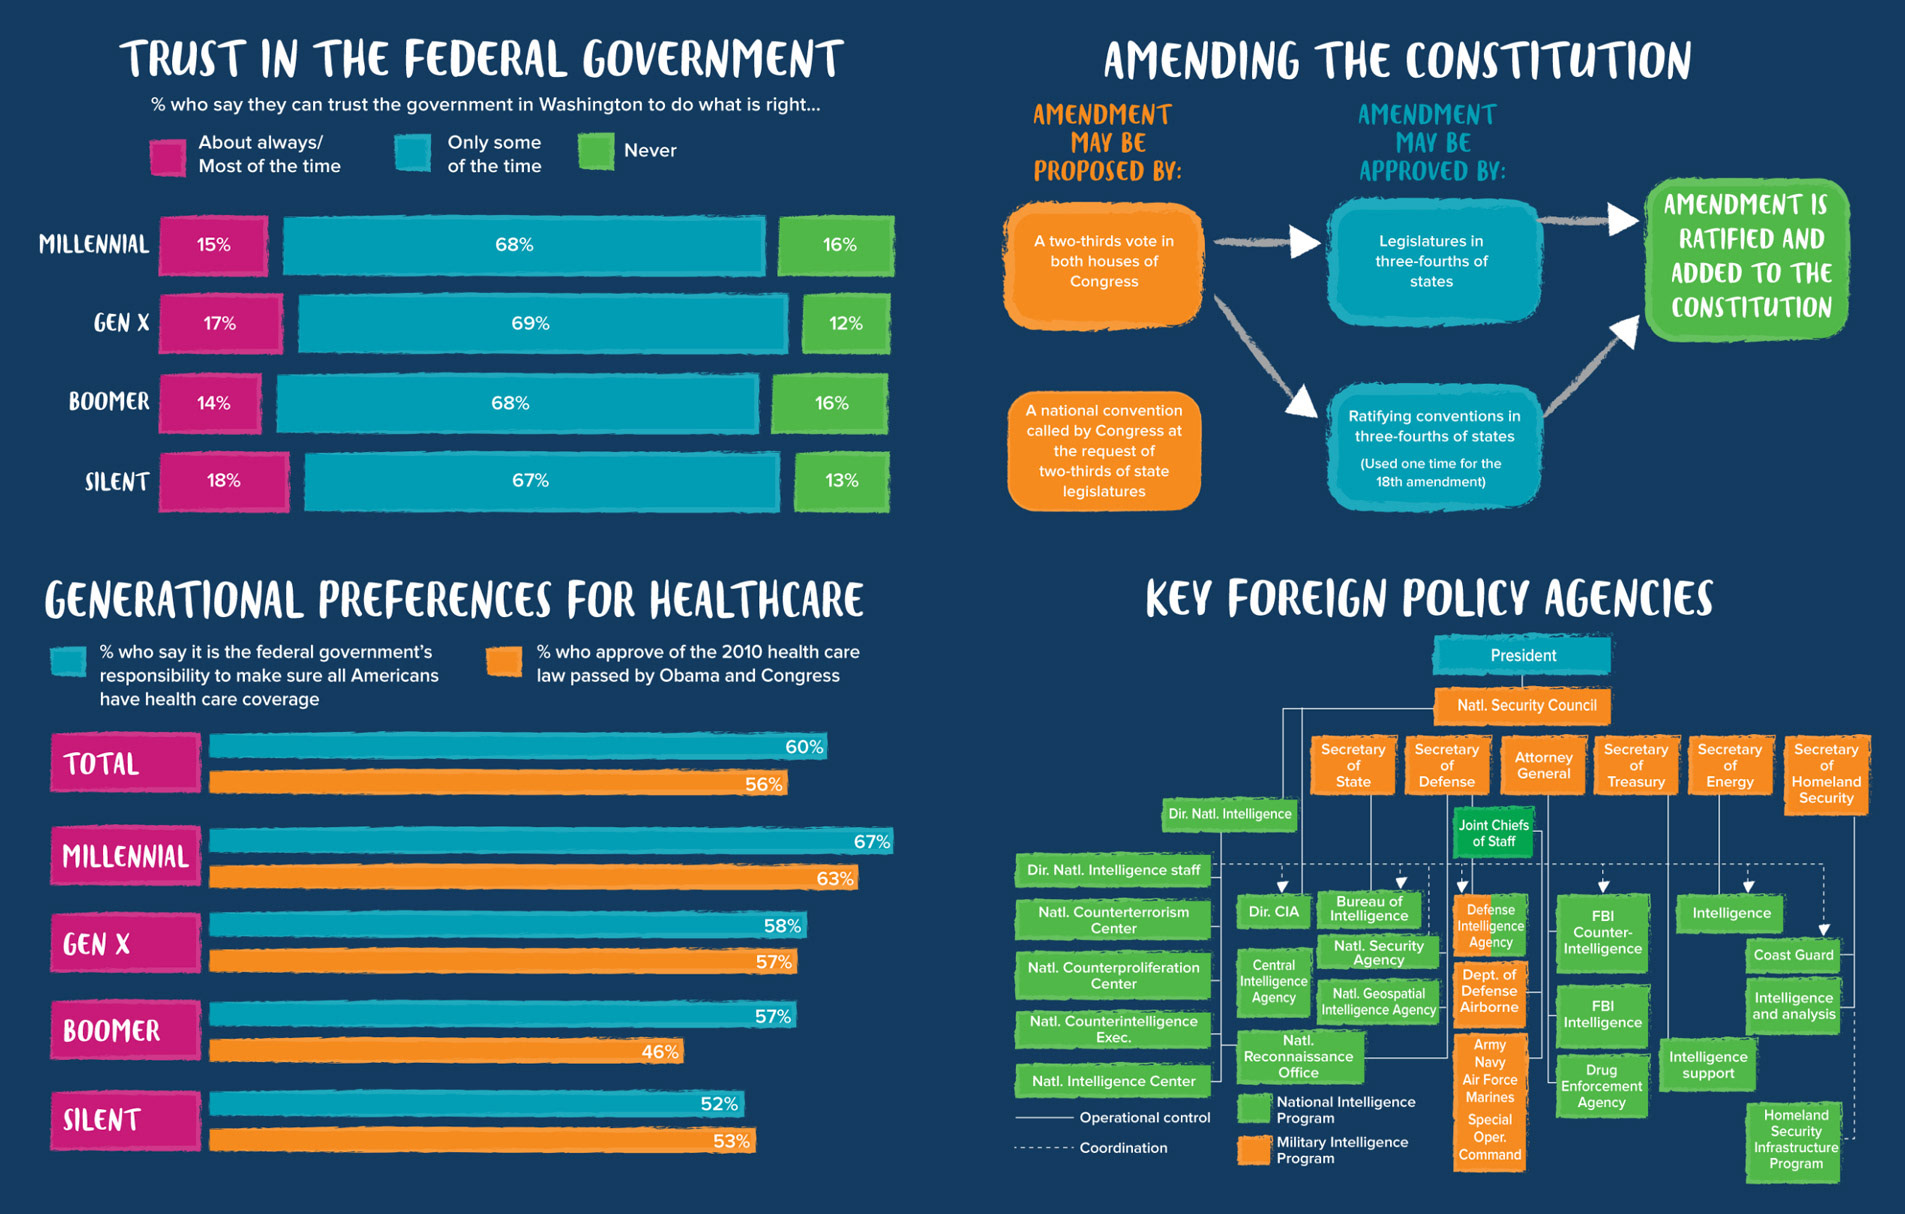
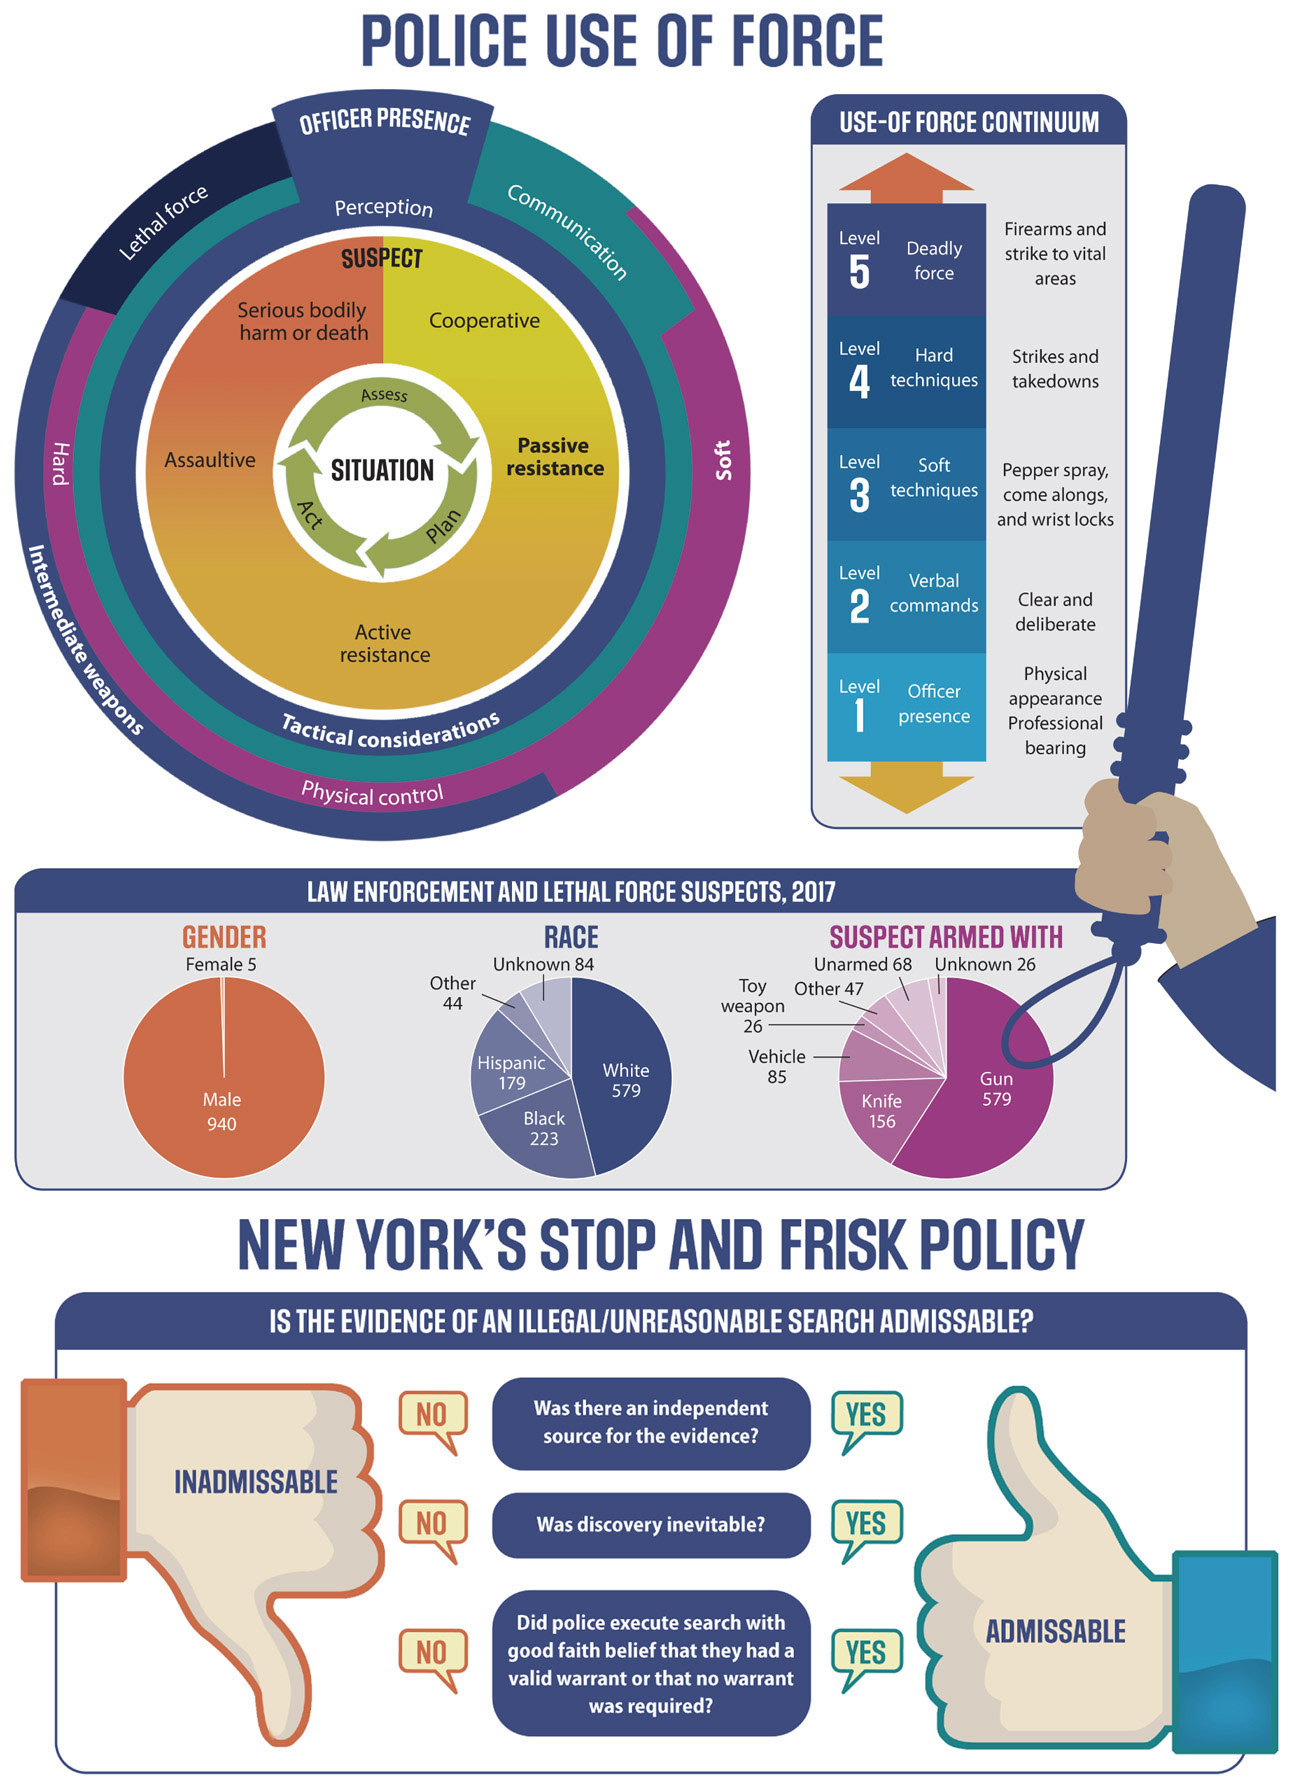
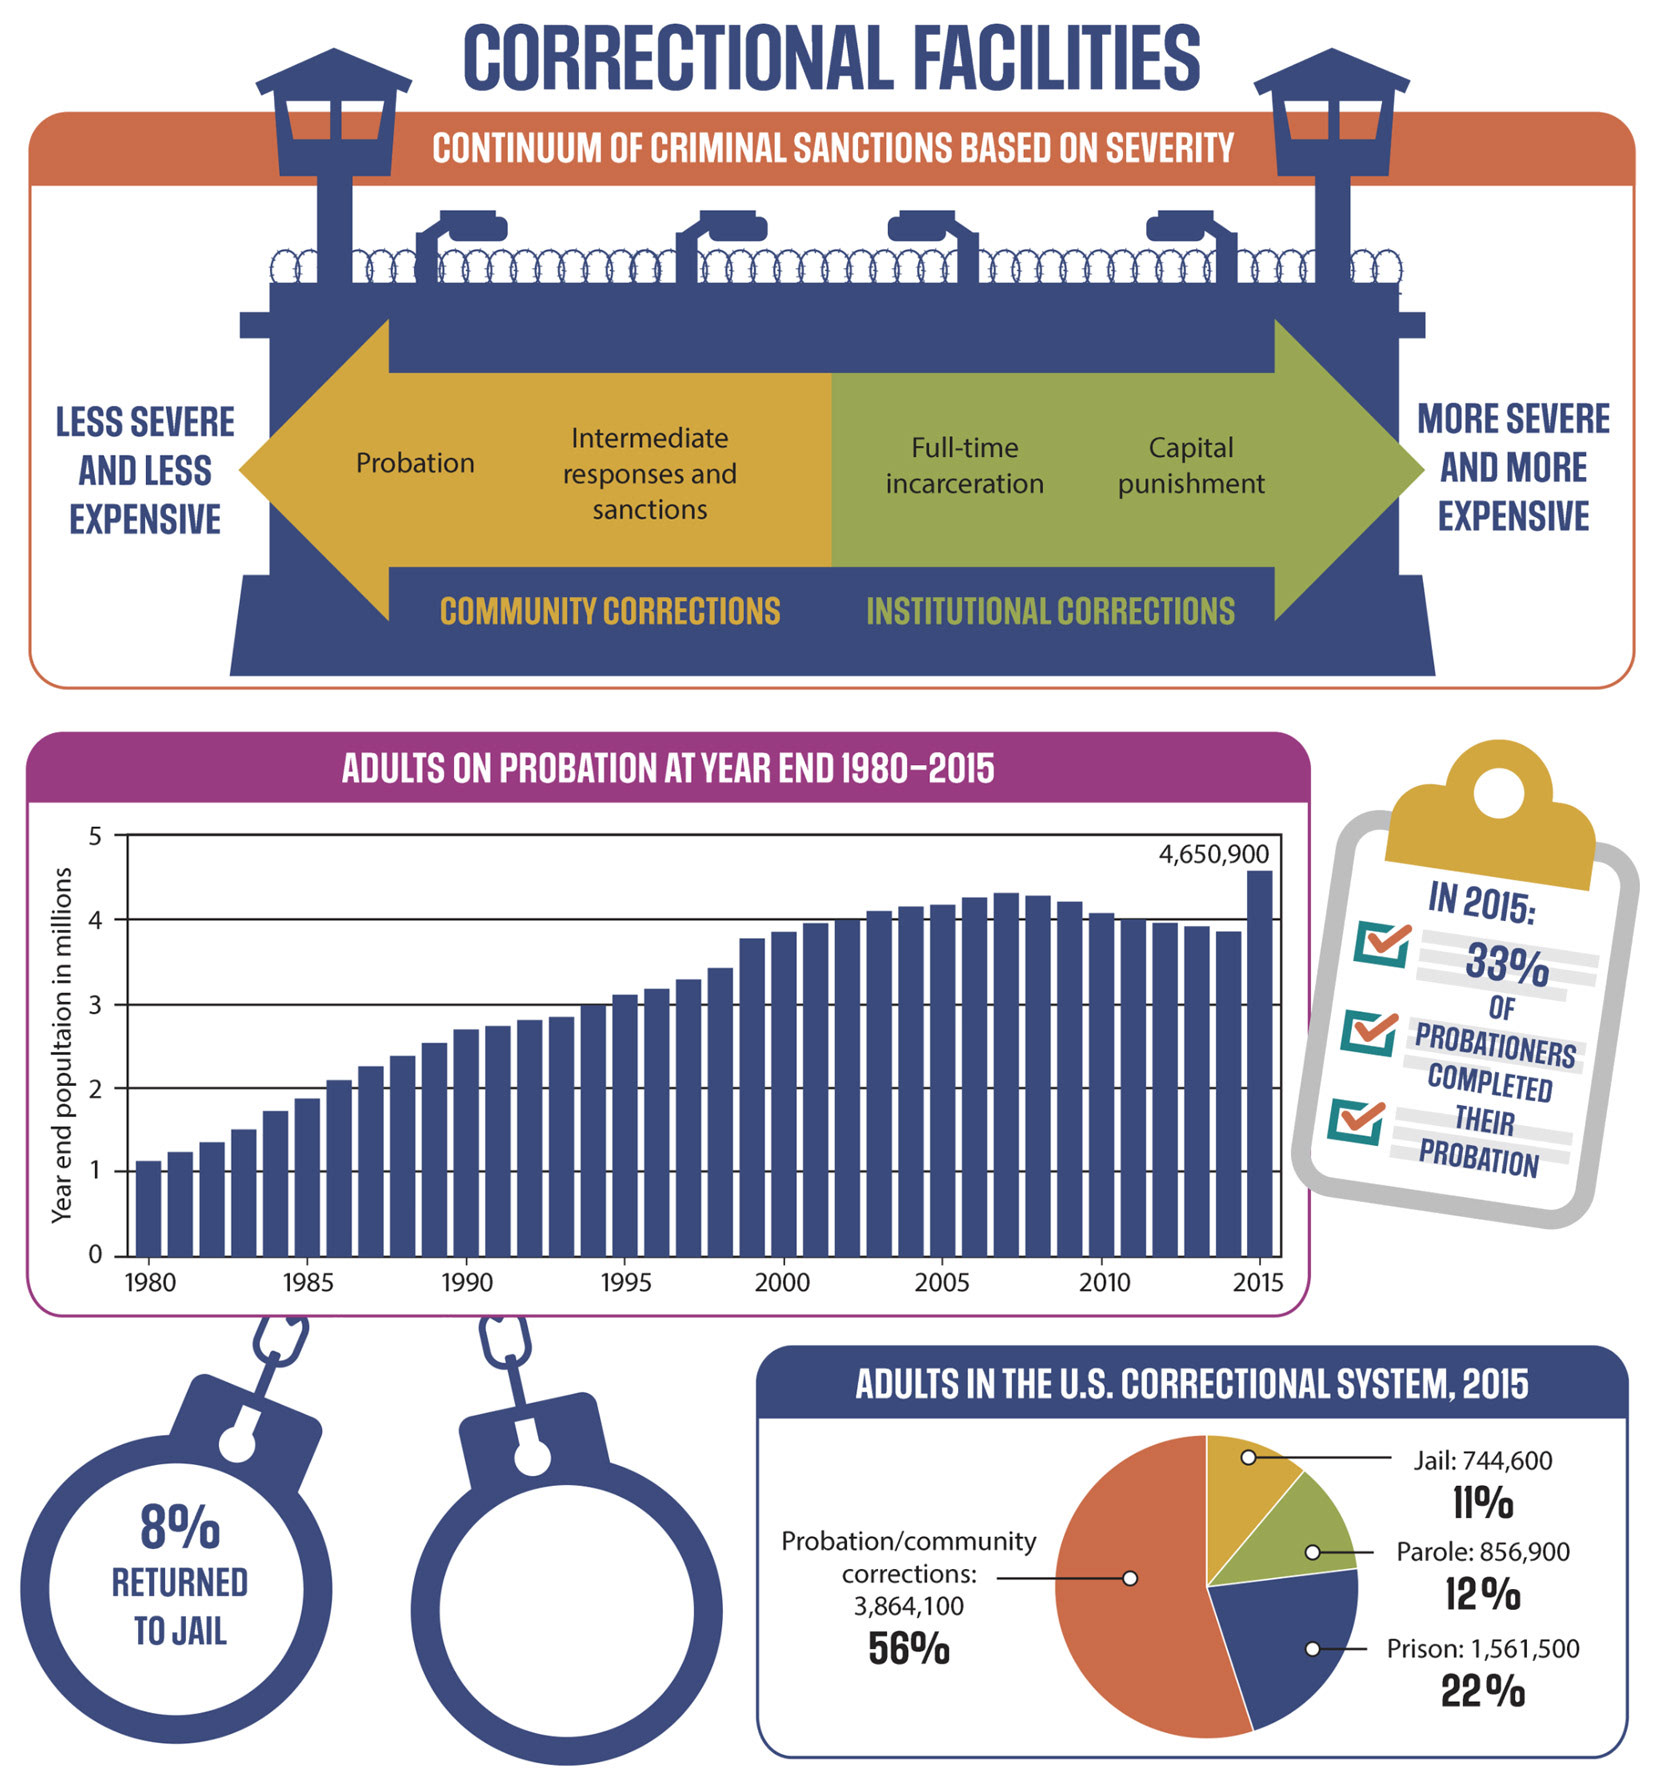
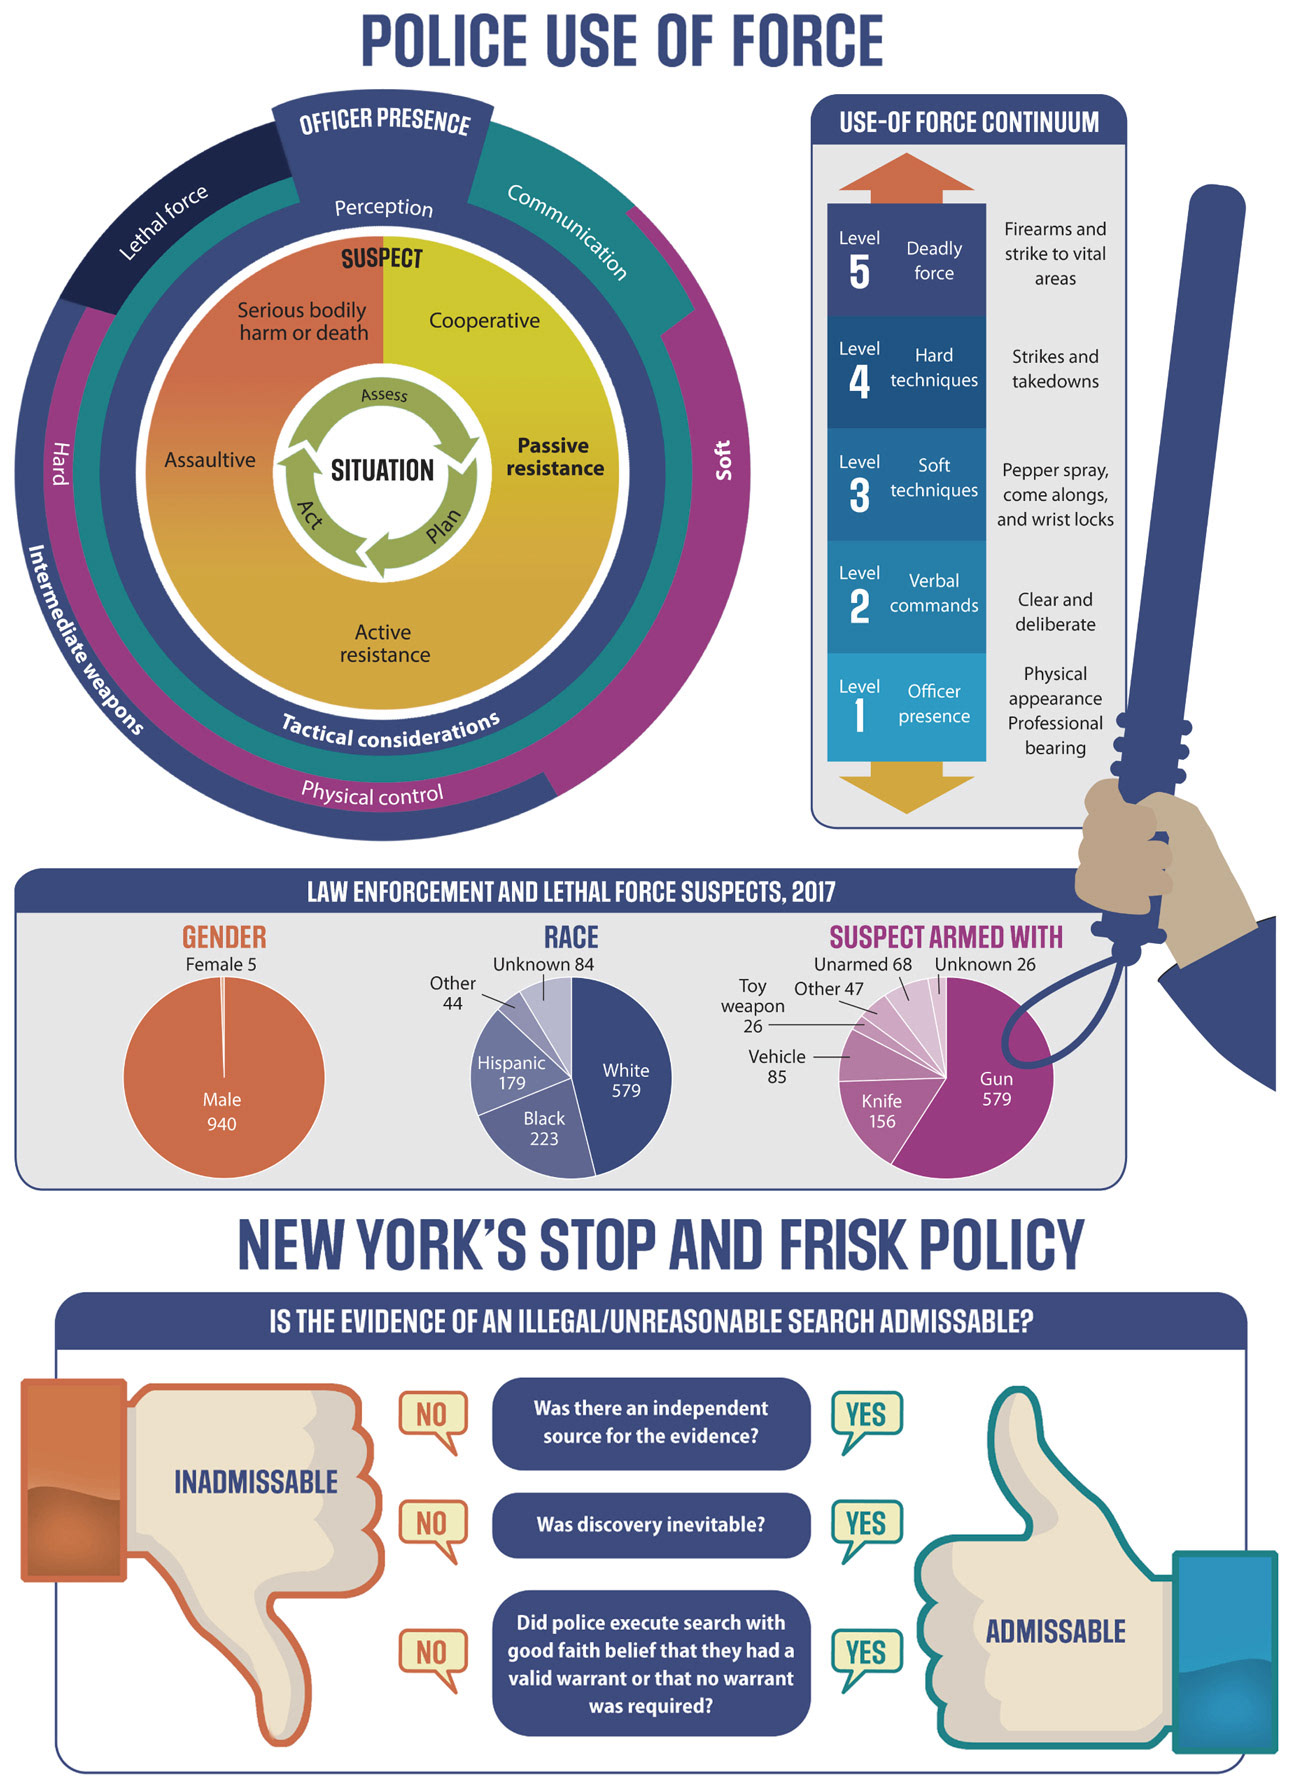
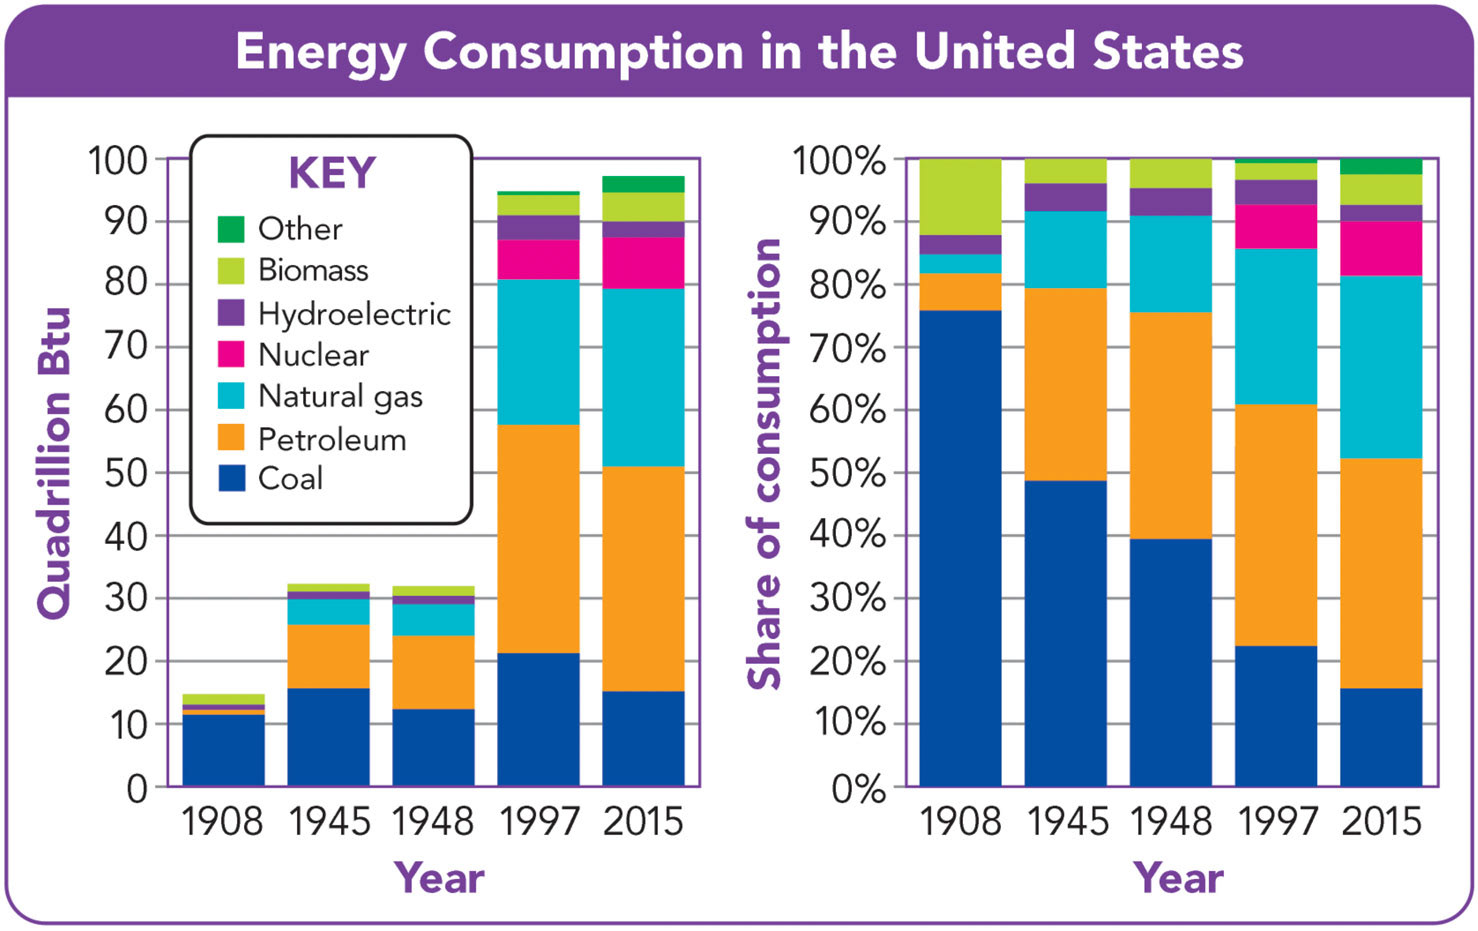
A diverse collection of educational charts, graphs, tables, and data visuals created to support instruction in science, math, social studies, and language arts. These graphics include bar graphs, pie charts, timelines, data tables, and infographics—ideal for textbooks, assessments, and classroom resources that help students analyze and interpret information visually.